Top Electrical Diagnostic Tools for 2026

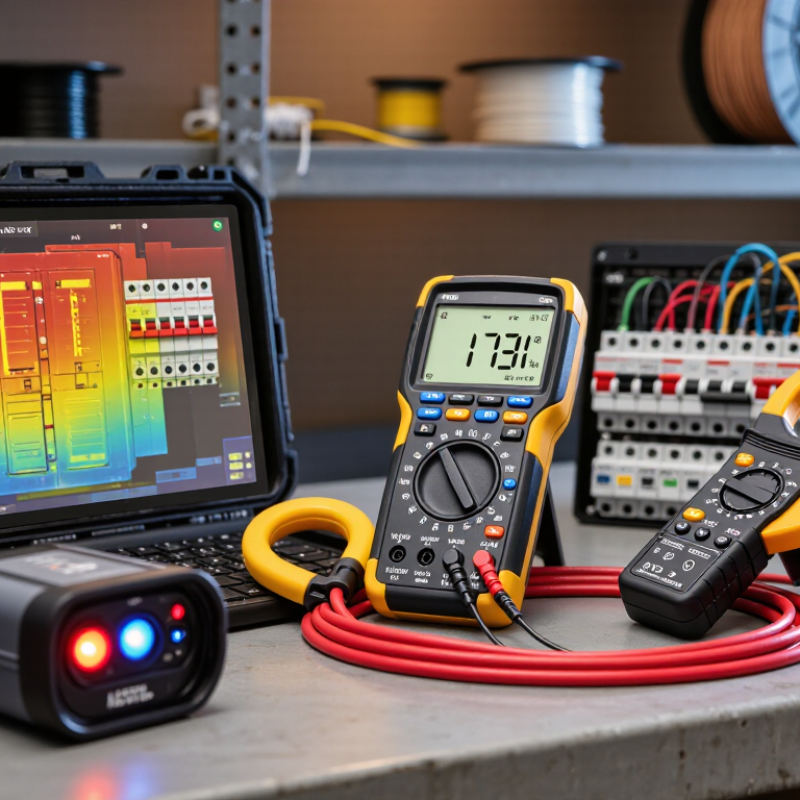
Electrical faults rarely announce themselves clearly. A warm breaker, a flickering light, or an unexplained voltage drop can point to very different causes. Electrical Diagnostic Tools help technicians turn these clues into measurable evidence. In 2026, the right selection still depends on the system, the task, and the person using the instrument. A digital multimeter can check voltage and continuity, while a clamp meter measures current without disconnecting a conductor. Thermal cameras can reveal unusual heat patterns. Circuit tracers and insulation resistance testers answer other questions.

No single tool does everything. That matters. A reading is only useful when the instrument is suitable, correctly configured, and in good condition. Before testing, qualified users should consider equipment ratings, inspect leads, and follow site safety procedures. These practical checks may seem routine, but skipping one can distort results or create avoidable risk. Calibration and clear documentation also help make findings repeatable, especially when several technicians inspect the same equipment.

This guide explores the leading tool categories for 2026, what each does well, and where its limits become important. It considers features such as measurement range, display clarity, portability, and data logging, alongside cost and maintenance. Not every advanced feature earns its place in a technician’s kit. Sometimes the best choice is a simpler instrument that answers the actual question reliably. The comparisons ahead are intended to support informed decisions, not replace training, manufacturer instructions, or sound professional judgment.
Top Electrical Diagnostic Tools for 2026

Electrical Diagnostic Tools in 2026: Categories and IEC 61010 CAT Ratings

Electrical diagnostic tools serve different points in an installation. Digital multimeters check voltage, resistance, and continuity; clamp meters measure current without opening a conductor. Insulation testers assess insulation condition, but their test voltage must suit the equipment. IEC 61010 CAT ratings describe a tool’s intended electrical environment and transient protection, not its general accuracy. CAT II applies to loads plugged into outlets; CAT III covers fixed installations and distribution circuits; CAT IV is intended for the supply origin, such as a service entrance. The distinction matters.

The U.S. Bureau of Labor Statistics recorded 145 fatal occupational injuries from exposure to electricity in 2022, underscoring why selecting the right instrument is a practical safety decision.

Match both CAT category and rated voltage to the measurement point; CAT III 600 V and CAT IV 300 V are not interchangeable labels. A higher CAT rating alone does not make a tool suitable for every task. Check its markings, leads, and condition before use. This is easy to overlook. Ratings also cannot replace safe procedures or training, and real sites can be messier than a category chart suggests.

Digital Multimeters: True-RMS Measurement and CAT III 1,000 V Models

For 2026, a digital multimeter should do more than display voltage. True-RMS measurement helps capture the heating effect of distorted AC waveforms, common around variable-speed drives and switching power supplies. An average-responding meter can misread these signals. Check the instrument’s stated bandwidth and crest-factor limits; “True RMS” is not a promise of accuracy at every frequency.

A CAT III 1,000 V rating suits measurements on fixed building installations, such as distribution panels, when used within the maker’s specified conditions. It does not make every connection safe. The meter, probes, and accessories all need suitable ratings, intact insulation, and correctly rated fuses. Small details matter. The U.S. Bureau of Labor Statistics’ 2023 Census of Fatal Occupational Injuries recorded 142 deaths from exposure to electricity, compared with 145 in 2022. Those figures are a reminder that a rating label cannot replace safe work practices. Before measuring, inspect the leads and verify the meter on a known source; after testing, verify it again. I still find this last check easy to skip when a job looks routine.

Thermal Imaging: Typical ±2°C Accuracy for Noncontact Fault Screening

A thermal image can reveal a warm connection before discoloration appears. Many electrical infrared cameras publish accuracy specifications of ±2°C or ±2% of the reading, whichever is greater. That figure describes instrument performance under stated conditions, not guaranteed accuracy on every cabinet. A loose lug may look conspicuous, but reflective metal, airflow, viewing angle, and equipment load can distort its apparent temperature. Small details matter.

ASTM E1934 provides guidance for infrared examination of electrical and mechanical equipment, and NFPA 70B (2023) includes thermography in electrical maintenance practices. Neither makes a bright spot a diagnosis. Not proof. Compare similar phases under comparable loads, record ambient conditions, and inspect through safe, suitable access. A matte, high-emissivity target can improve readings on reflective surfaces when properly applied. If a hotspot could affect safety or operations, confirm it using qualified procedures and other measurements. I would still question a single dramatic image: it may show a real fault, or simply a poor angle. A useful screening tool, not a substitute for diagnosis.

Top Electrical Diagnostic Tools for 2026 — Thermal Imaging: Typical ±2°C Accuracy for Noncontact Fault Screening

A practical reference for selecting and using thermal imaging equipment during electrical inspections. Specifications vary by instrument; verify the relevant datasheet and operating conditions.

Specification or Inspection Factor Typical Range or Practice What It Means for Electrical Screening Important Qualification
Temperature measurement accuracy Often stated as ±2°C or ±2% of the reading, whichever is greater Useful for identifying temperature differences and prioritizing components for further investigation. This is a typical specification, not a universal guarantee. Accuracy depends on the instrument, calibration, target, distance, and environment.
Detector resolution Common handheld options range from about 160 × 120 to 640 × 480 pixels Higher resolution can make small or distant components easier to distinguish and measure. Resolution alone does not determine measurement accuracy; focus, field of view, and measurement distance also matter.
Thermal sensitivity (NETD) Many inspection cameras specify roughly 50 mK or better; values vary by model Lower NETD can help reveal subtle temperature contrasts between nearby areas. NETD describes sensitivity to small temperature differences, not absolute temperature accuracy.
Measurement temperature range Ranges such as approximately −20°C to 550°C are available in some instruments A suitable range can cover routine panel inspections and hotter components. Available ranges and accuracy may change across the instrument’s specified temperature bands.
Emissivity setting Adjustable emissivity is common; about 0.95 is often a useful starting point for many non-reflective surfaces Correct emissivity improves readings from painted, oxidized, or insulated surfaces. Shiny metal can have low and variable emissivity and may reflect nearby heat sources, making its apparent temperature misleading.
Electrical inspection targets Connections, fuses, breakers, busbars, cable terminations, and phase-to-phase comparisons Uneven heating under comparable load can help flag loose, overloaded, imbalanced, or deteriorating connections. A thermal pattern indicates an area for investigation; it does not by itself identify the root cause.
Load and operating conditions Inspect equipment in normal, documented operating conditions whenever safe and permitted Load information helps distinguish meaningful heating from temperature differences caused by changing demand. Record load, ambient conditions, distance, and inspection time so follow-up images can be compared fairly.
Image focus and measurement distance Focus carefully and keep the target large enough within the measurement area Sharp images and adequate target coverage support more dependable temperature readings. A small target surrounded by hotter or cooler areas can produce a mixed reading; follow the instrument’s distance-to-spot guidance.
Interpretation and follow-up Compare similar components and phases; confirm suspected issues using appropriate electrical tests Temperature differences can help rank findings for inspection and maintenance. There is no single temperature-difference threshold suitable for every installation. Apply site procedures and qualified-person judgment.
Safety and access Use the required electrical safe-work practices, PPE, and access controls Noncontact imaging can support screening from a distance where a safe viewing position is available. A thermal camera does not make energized equipment safe to approach or open. Follow applicable regulations and site safety procedures.

Note: Thermal imaging is a screening and condition-monitoring method. Confirm significant findings with qualified personnel and suitable diagnostic procedures before making repair decisions.

Power Quality Analyzers: IEC 61000-4-30 Class A and 50/60 Hz Systems

Top Electrical Diagnostic Tools for 2026

Power quality problems often appear as brief events: a voltage dip during motor startup, or flicker beside a changing load. A Class A analyzer helps capture these consistently. IEC 61000-4-30:2015+A1:2021 specifies measurement methods for Class A instruments, supporting comparable results across devices. For voltage magnitude, it uses 10-cycle windows on 50 Hz systems and 12-cycle windows on 60 Hz systems. Both span about 200 milliseconds. Small timing differences matter.

On a factory floor, check the analyzer’s configured nominal frequency before comparing readings. A 50 Hz setup should not silently stand in for a 60 Hz network. Class A status also does not replace calibration. IEC 62586-2:2017 describes functional testing and uncertainty requirements for power quality instruments. Keep calibration records, and note probe placement, voltage connections, and event timestamps. Details count. They make later reviews less guessy.

For useful field work, trend voltage dips, swells, frequency, and flicker alongside load changes. Compare the same reporting intervals across sites. A sharp dip on a 10-minute chart may hide a much shorter event, so retain event-level records where available. Still, standards cannot explain every strange reading. Loose connections, incorrect setup, or a poorly chosen measurement point can mislead even a capable instrument. A careful check at the panel often tells you more than another dashboard.

Insulation Testers: Common 250, 500, and 1,000 V DC Test Levels

Top Electrical Diagnostic Tools for 2026

Insulation testers apply DC voltage to check whether electrical insulation is resisting leakage current. The selected level matters.

IEC 61557-2:2019 specifies instrument test-voltage classes including 250, 500, and 1,000 V DC. IEEE Std 43-2013 recommends 500 V DC for rotating-machine windings rated below 1 kV, and 500–1,000 V for windings rated from 1 to 2.5 kV.

These are reference points, not universal settings. A 250 V test may suit some sensitive control circuits, but the equipment instructions should decide.

Isolate the circuit first. Check connected electronics and surge-protection components before applying voltage; a tester can damage items left in circuit.

Use 1,000 V only when the insulation system is rated for it. Keep the probes steady, and note the test duration, temperature, and humidity beside each reading.

Small details matter. Insulation resistance changes with temperature, so readings taken in a cold workshop may not compare cleanly with warmer results.

One limitation is easy to overlook: a single resistance value cannot explain every fault. Compare repeat measurements under similar conditions, and investigate unexpected drops rather than treating one number as a verdict.